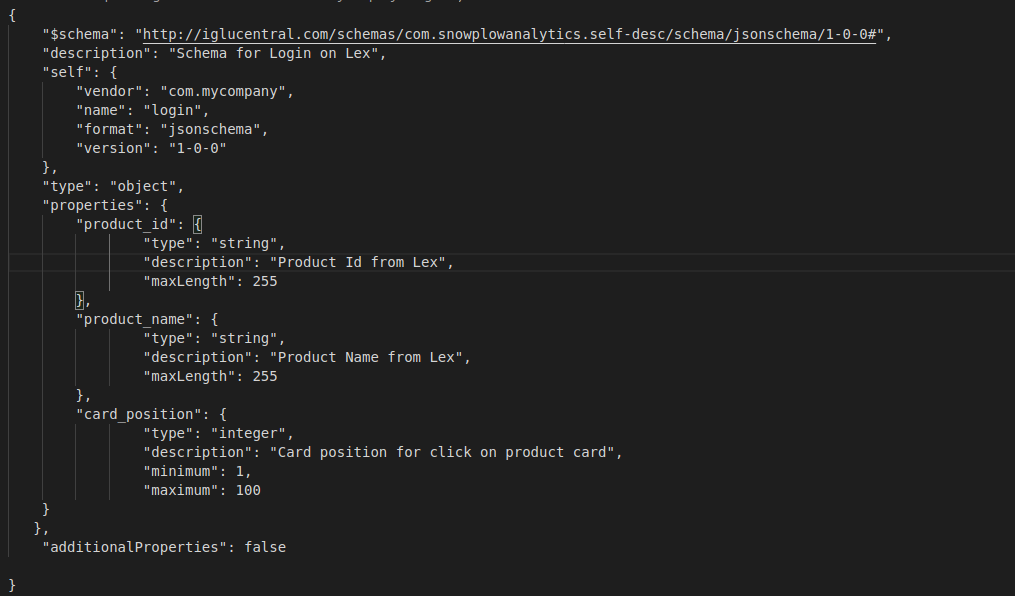
I created my own schema, upload into iglu server (./igluctl static push --public schemas/com.snowplowanalytics.snowplow/login/ {iglu endpoint} {API KEY}) but when executing my easy example as the image attached, I couldn’t see the data in Elastic and S3 the other events works fine. Should I do something else?
I’ve checked into IGLU RDS and See the schema uploaded
I have already created, validated and uploaded the schema, but I didn’t found where to enable the schema and sending the event in the app to S3 and Elastic good Index.
What should I do to see the data in S3 good enrichment and good index in Elastic Search
Vendors do not match. In tracking you have com.snowplowanalytics and in RDS you have com.snowplowanalytics.snowplow (with additional snowplow). Vendor names have to match.
Also, I recommend you to use your company’s name for the vendor. Technically, there’s no difference, but it can get confusing once you’ll have tens of schemas.
Hi @anton thanks for your reply. I Will check and back you soon.
With this change, automatically the schema Will papear in the shcema field in S3 good enrichment event when I add the schema field in the good index or should I do something else.
About your suggestion, I Will put another vendor as my company
With this change, automatically the schema Will papear in the shcema field in S3 good enrichment event when I add the schema field in the good index or should I do something else.
Most likely yes, but there’s a small heads-up.
If you tracked any events with a new schema before you uploaded the schema - your resolver can cache the absence of the schema, so it doesn’t retry it immediately next time. However, this absence cache is usually short-living (depending on timeout config in your resolver.json) and eventually it will manage to resolve it, just not immediately.
In other words, if you tracked any events with the schema already you have two choices:
wait a little bit - the schema will be resolved
reboot your enrich asset - it will be forced to re-fetch all schemas
If you haven’t tracked it before uploading - it will appear immediately.
The data will either go to the good stream, or land in the failed events stream, along with an error message which tells you why it didn’t pass validation (or failed for some other reason).
You’ll need to access the failed events, and debug according to the error messages. To do so, the most common options are to set up the S3 loader, or set up the Elasitcsearch loader on the failed events stream.
I would highly recommend, though, that you use either Snowplow Mini or Snowplow Micro to debug your tracking. Both come packaged with easy ways to access your failed events, and will give you a fast feedback loop. In your case, Mini is likely to be most helpful since it’ll closely mirror your production setup.
Generally you’ll use one of those tools to debug any new tracking setup, and the main pipeline’s failed events stream to keep track of production issues.
Hi @Colm
I Got this error:
{
“schemaKey”: “iglu:com.snowplowanalytics.snowplow/unstruct_event/jsonschema/1-0-0”,
“error”: {
“error”: “ValidationError”,
“dataReports”: [
{
“message”: “$.schema: is missing but it is required”,
“path”: “$”,
“keyword”: “required”,
“targets”: [
“schema”
]
},
{
“message”: “$.data: is missing but it is required”,
“path”: “$”,
“keyword”: “required”,
“targets”: [
“data”
]
},
{
“message”: “$.event: is not defined in the schema and the schema does not allow additional properties”,
“path”: “$”,
“keyword”: “additionalProperties”,
“targets”: [
“event”
]
}
]
}
}
This looks correct - just to confirm are you including the Javascript 3 tracker or using the previous Javascript 2 tracker? (this will be at the top of the Javascript file you are including as part of the initialisation). I think it may be possible to get this output if you use the v3 Javascript tracker syntax with the v2 tracker library.
Well spotted by mike. Indeed that’s version 2 of the tracker. Easiest path to resolve is to use version 3 instead - here’s the relevant part of the docs.
Ps. We recommend self-hosting for production, as outlined here. Of course it’s up to you and certainly to get started there’s no harm at all in using the cdn, I just mention it for future reference.
In your Iglu resolver you’ll need to add the Iglu repo URL rather than the collector URL. The Iglu URL is the one that you pushed your schema to sp-iglu-lb-prod-25555...
If you can’t find the iglu_server_dns_name, it will be somewhere in the output of terraform show for this module. As mike said it’s the same URL that you would’ve used to upload the schema.
I can’t see the host that you are pushing to - but if you are getting a 200 back from the Iglu server that’s a good sign that it’s been created successfully.