Sankey Diagram/User Journeys

Hi all,

Has anyone used Snowplow data to visualise a Sankey diagram of user journeys through a website? Similar to the User Flow report in GA (but better, obviously), in order to see drop-offs and popular paths through a website.

I know tools like Adobe and SAS make this kind of analysis quite straightforward, but I’m not sure what format the data would need to be in in order to generate this kind of visualisation.

For reference, below is the sort of viz I’d be looking for:

http://blogs.sas.com/content/sascom/files/2014/08/vae_path_analysis_08.png

I have been trying to get this kind of visualisation for a while. The best options that I have found are:

  • If you are using tableau you can use this sample to make it happen. It is very complicated and very hacky but results in a nice effect with tooltips and highlighting - https://www.theinformationlab.co.uk/2015/03/04/sankey-charts-in-tableau/

  • This is possible with r using the riverplot library. This is much easier to use and makes a lot more sense in how the diagram is contructed. The problems occur when getting your event data into the aggregated numbers in the lists and doing them in the right order - https://cran.r-project.org/web/packages/riverplot/riverplot.pdf

  • The third (but very expensive) option is using Amplitude. They have a pathfinder feature where non-technical users can drag and drop the events, the order that they are done by the user and filters around these events and the diagram will be generated by their systems. This is by far the most idiot proof option - https://amplitude.com/pathfinder?ref=nav

  • An open source version of this is airbnb’s superset platform. I have found this a bit tricky to setup and really does take some grunt on your redshift cluster to get moving but its free and it works - https://github.com/airbnb/superset

I hope this helps!
Bruce

1 Like

Thank you so much for the examples Bruce. I’ve worked through the Tableau example, and while it’s a bit slow with the volume of data it does still work (though like you say, a hacky approach).

I’ve used referrer URL and Page Url to see some of the most common navigation paths, though it would be nice to get a fuller journey (subsequent and previous pages). I haven’t tried the example in R out yet, but will endeavour to do so.

Hi jrpeck,

Path analysis is a form of process mining, check this article on path analysis with GA/Snowplow data.

Joao Correia

Modelling

From a modelling perspective there’s two things that would be useful to add to this that either enrich the representation or are required for something like a Sankey diagram:

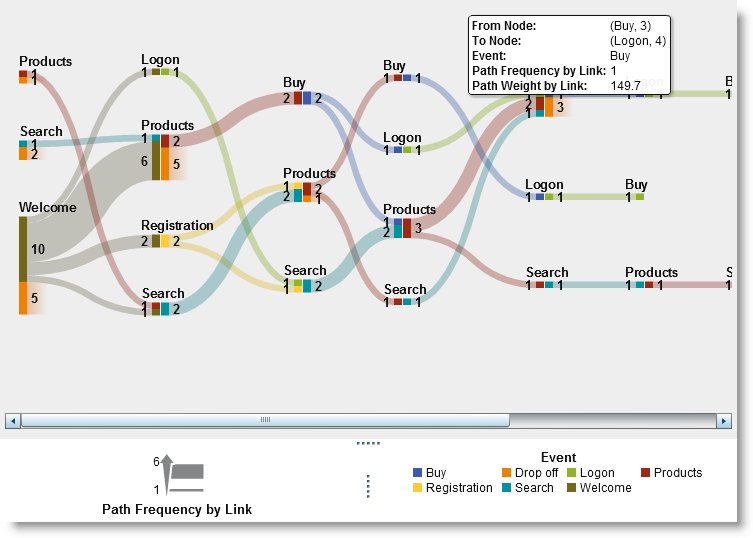
  1. The notion of a pseudo time-based index for each action, e.g., first page view = 1, 3rd page view = 3 which in a Sankey roughly corresponds to your x-axis.
  2. If required the time between actions (Sankey diagrams don’t really show this so visualisations such as directed acyclic graphs are often a better option here).
  3. A scalar value that represents the magnitude (“flow”) from one state to another.

To generate the first two we can use Redshift window functions by partitioning by user and by session and to generate the final element we can simply aggregate our raw data in whatever means required.

A pre-aggregated query that gives us the raw data might look something like this:

SELECT
  derived_tstamp,
  domain_userid,
  domain_sessionidx,
  refr_urlpath,
  page_urlpath,
  event_name,
  ROW_NUMBER()
  OVER (
    PARTITION BY domain_userid, domain_sessionidx
    ORDER BY derived_tstamp ASC ) AS event_index,
  DATEDIFF(
      'seconds',
      LAG(derived_tstamp, 1)
      OVER (
        PARTITION BY domain_userid, domain_sessionidx
        ORDER BY derived_tstamp ASC ),
      derived_tstamp
  )                               AS last_action
FROM
  atomic.events
WHERE
  collector_tstamp > SYSDATE - INTERVAL '1 days'
  AND
  event_name = 'page_view'

We use the ROW_NUMBER() window function to generate our event index, and the LAG window function to get the time between subsequent page views. Some things to note here is that we’re limiting ourselves to page_views, but we could just as easily include additional events such as add_to_cart. This example also uses derived_tstamp rather than collector_tstamp, the short answer being that this will give us an accurate representation of time for the users device (there’s a great blogpost on the Snowplow representations of time here).

From here it’s easy to derive by using a group by statement (on refr_urlpath, page_urlpath and event_index) to generate your magnitude. This may be something like a COUNT(*) or could be something more useful such as a count of unique users COUNT(DISTINCT(domain_userid)) that have performed this action.

Visualisation

Visualisation is a little tricky. As @brucey31 has mentioned above the method in Tableau is a bit hacky and in a graph implementation (such as a bidirectional cyclic graph) you lose some of the inherent value of having an event_index that also plays a role in the layout of the visualisation.

That said there’s a fantastic d3 library that generates Sankey diagrams to do some of the hard parts (layout generation) and provides a simple interface for data.

2 Likes

Hi!
I know this post is old, but for those interested, there is a no-code tool called SankeyJourney that does exactly that (i.e. visualise a Sankey diagram of user journeys through a website or an app).

It contains many great features that allows you to dig pretty deep into behavioral data.